Bitcoin’s price correction across multiple timeframes reveals short-term bearish pressure while maintaining a bullish outlook in the long term.

Bitcoin
Bitcoin’s (BTC) recent price action highlights a bearish correction across short-term timeframes, while the broader trend remains bullish, with key levels dictating potential opportunities for traders.
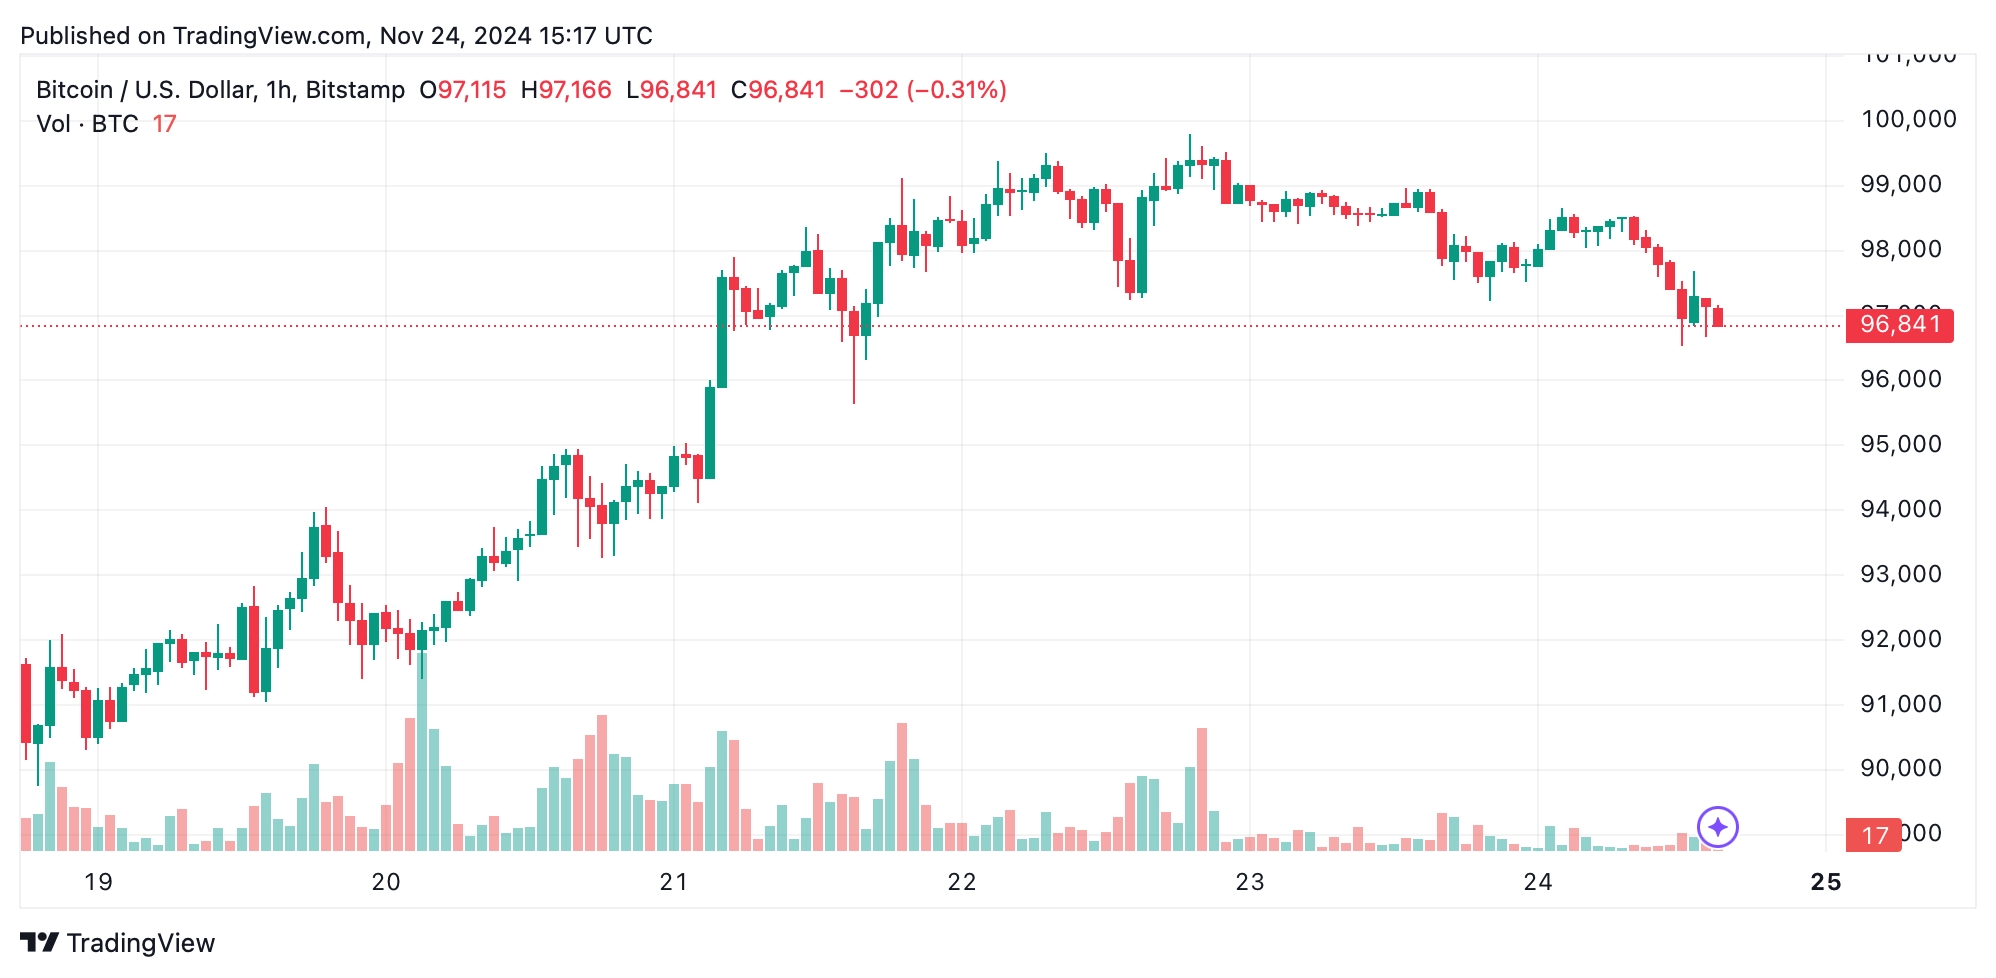
 BTC/USD 1-hour chart via Bitstamp on Nov. 24, 2024.
The hourly chart reveals a short-term bearish trend for bitcoin, with price action oscillating between $96,556 and $97,118. Increasing selling volume and consecutive red candles indicate a dominant bearish sentiment. A small green candle hinted at a reversal, but the lack of follow-through confirmed the downward momentum. Key support rests at $96,500; a break below this level could trigger further selling toward $95,000. Traders should look for a decisive breakout above $97,500, supported by strong volume, before considering long positions.
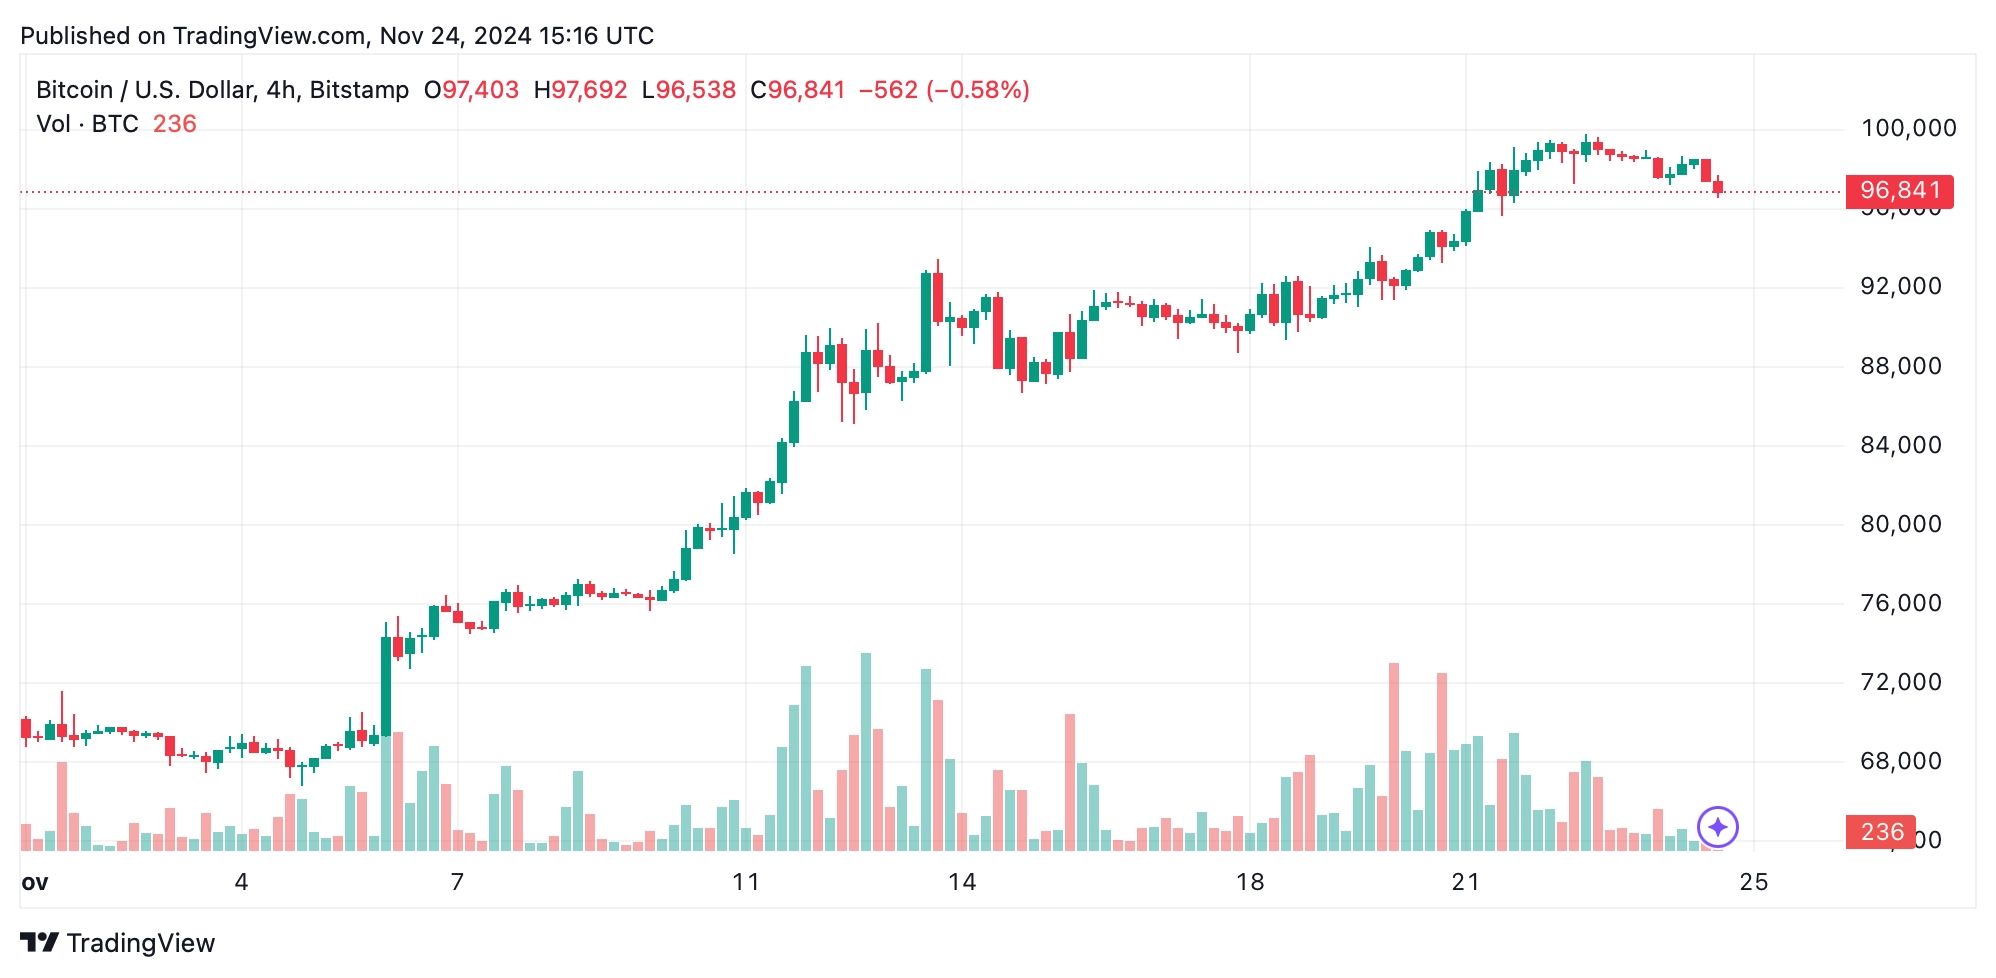
 BTC/USD 4-hour chart via Bitstamp on Nov. 24, 2024.
On the 4-hour chart, bitcoin is in a clear downtrend, characterized by lower highs and lower lows. The price has retraced from a local peak of $99,800, and support at $96,500 remains pivotal. Selling volume surpasses buying volume, reinforcing bearish momentum. Should bitcoin hold this support, a short-term bounce is plausible; however, failure to sustain this level could push prices down to $95,000 or lower. Resistance at $98,000 to $99,800 must be reclaimed for the mid-term trend to shift bullish.
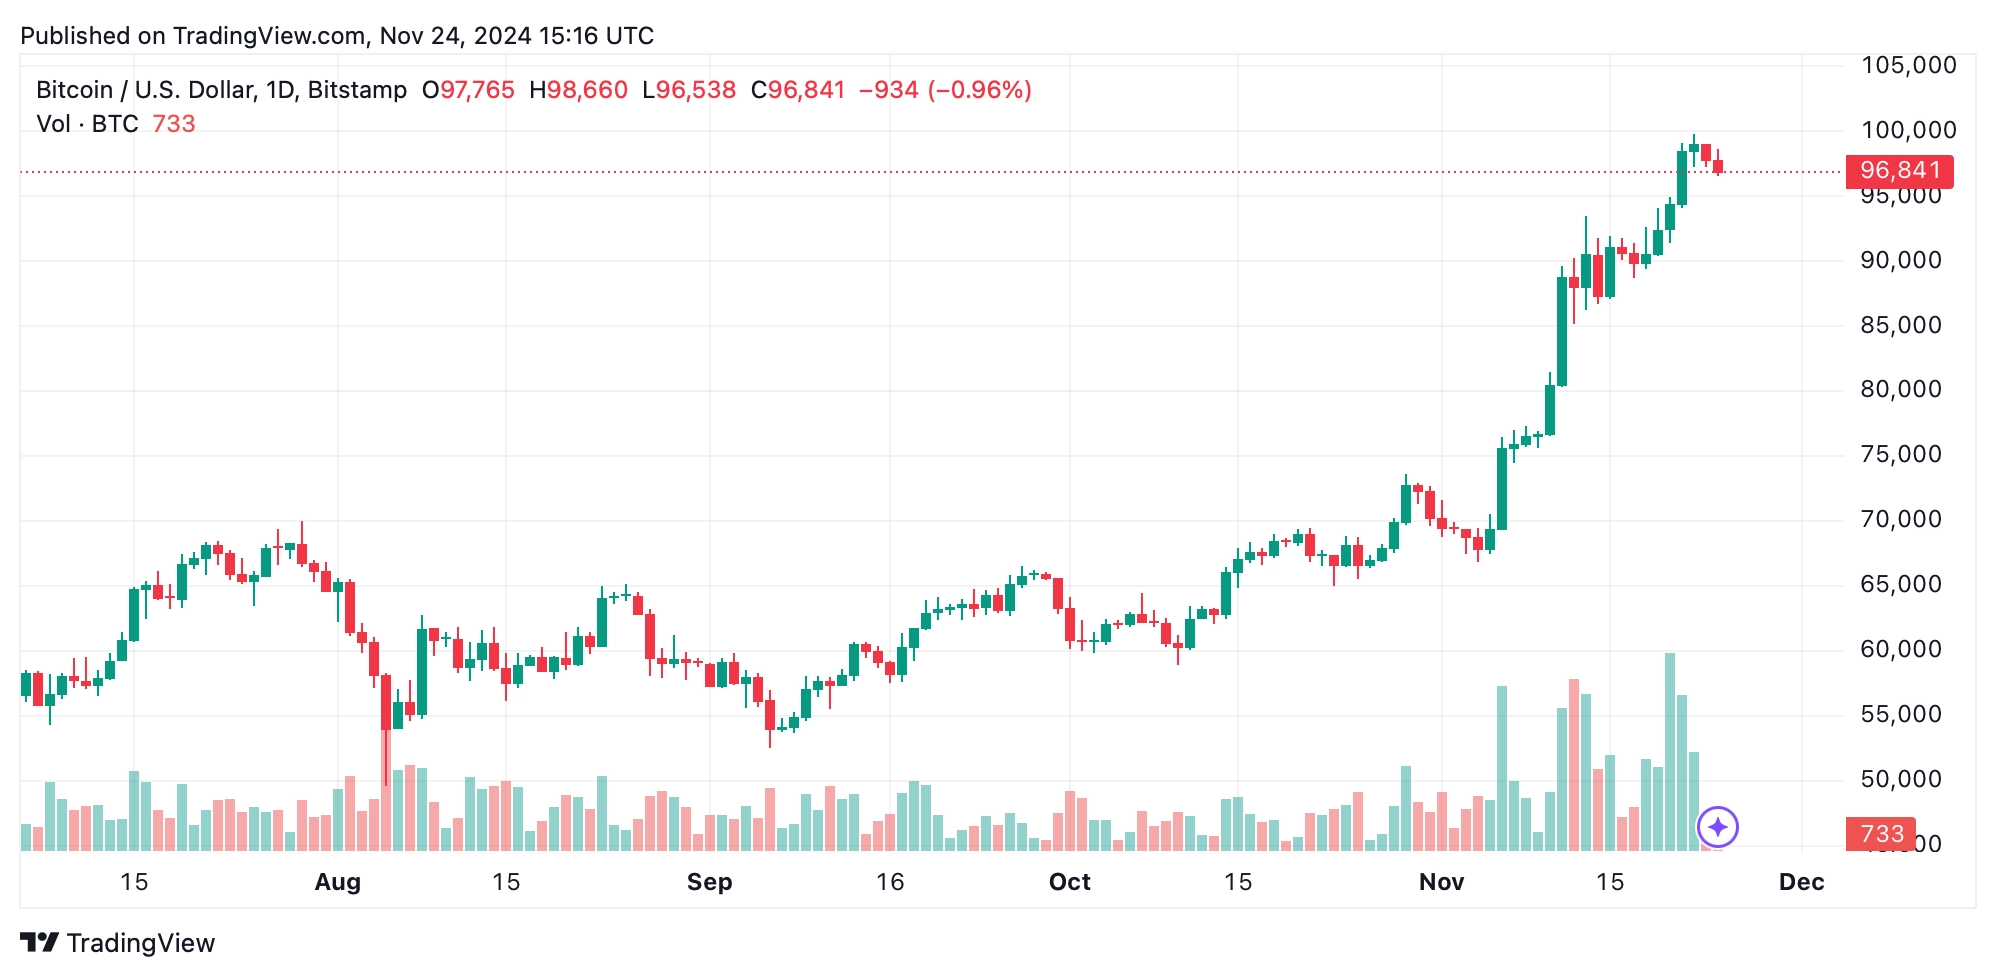
 BTC/USD daily chart via Bitstamp on Nov. 24, 2024.
The daily chart reflects a broader bullish trend, though recent price action suggests exhaustion. Bitcoin’s rally to $98,907 is followed by declining trade volume, hinting at waning momentum. A doji candlestick near the recent peak emphasizes market indecision, leading to a pullback. Support at $96,000 may provide an attractive entry point for long positions, provided volume confirms a buying resurgence. Should this level fail, bitcoin could retrace to $90,000.
From an oscillator perspective, the relative strength index (RSI) at 75 suggests bitcoin is overbought on the hourly chart, signaling caution for new longs. The moving average convergence divergence (MACD) level remains positive at 6,922, indicating upward momentum on higher timeframes. Momentum indicators like the awesome oscillator and exponential moving averages (EMAs) from 10-period to 200-period all favor buying, highlighting the long-term strength despite short-term corrections.
Bull Verdict:
Bitcoin’s long-term bullish trend remains intact, supported by strong momentum indicators and upward-moving averages, making pullbacks to $95,000 or $96,500 potential buying opportunities for traders seeking the next rally.
Bear Verdict:
Short-term bearish pressure dominates, with key support at $96,500 under threat; a decisive break below this level could accelerate bitcoin’s decline toward $95,000 or lower, signaling caution for bullish positions.


