- ETH recently recorded one of the largest increases in stablecoin supplyoften a sign of rising utility.
- Investors long-term outlook for ETH has surged accordingly. However, spot traders are still selling to the market.
Despite Ethereums [ETH] positive outlook, its price dropped by 1.75%, continuing the downward trend observed over the past week.
Analysis indicates that the broader sentiment around ETH remains bullish. However, the asset continues to face downward pressureparticularly from spot transfers that are not aligned with the broader market outlook.
Surge in stablecoin supplyWhat happens to ETH?
In the past 24 hours, Ethereum recorded one of the most significant stablecoin inflows in the market.
Roughly $1.4 billion worth of stablecoins were added to the Ethereum network; a substantial amount. A surge of this magnitude suggests increased demand for stablecoins by ETH users.
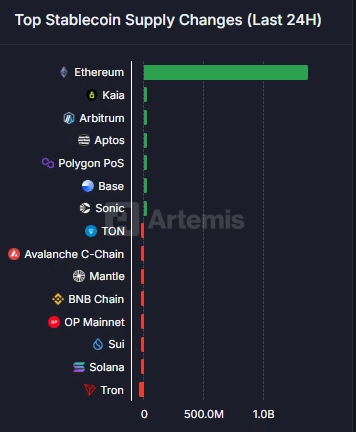
Source: Artemis
This implies more activity on the network, which could lead to increased ETH usage. As a result, wallet balances holding ETH are likely to rise.
According to Artemis data, the Bridged Netflow metric also spiked over the past 24 hours.
Bridged Netflow measures the volume of assets moved into ETH from other chains. At the time of writing, $114,000 had flowed into Ethereummost of it from SOL investors selling their holdings.
An increase in bridged inflowespecially one dominated by holders of major cryptocurrenciessuggests these groups consider ETH more bullish in comparison.
If this trend continues, its likely to positively impact ETHs price, indicating growing capital inflow and, more importantly, interest from major investors.
Long-term outlook remains strong
Notably, this surge in stablecoin supply coincided with a significant rise in Total Value Locked (TVL) across Ethereum protocols.
TVL tracks the amount of liquidity deposited into protocols for various activities over time.
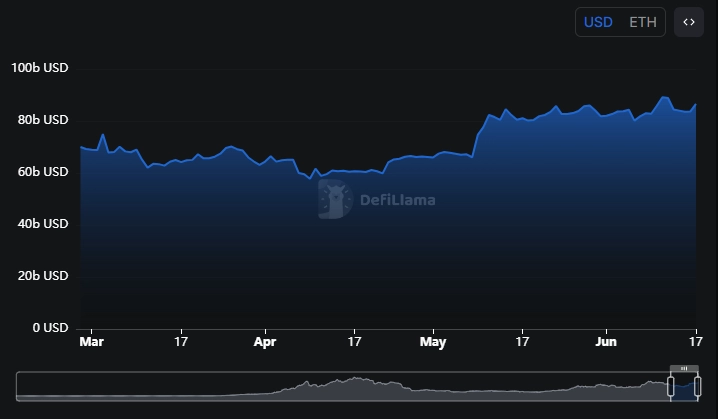
Source: DeFiLlama
As of press time, TVL had risen by 3.46%, climbing from $83.674 billion to $86.558 billionan increase of $2.88 billion in a short span.
This further supports the markets bullish sentiment. It suggests that a large portion of ETH has been locked up by investors, thereby reducing its circulating supply.
However, AMBCrypto analysis traced the recent market decline to increased activity by spot traders who have been selling their holdings.
At press time, these traders had offloaded $61 million worth of ETH.
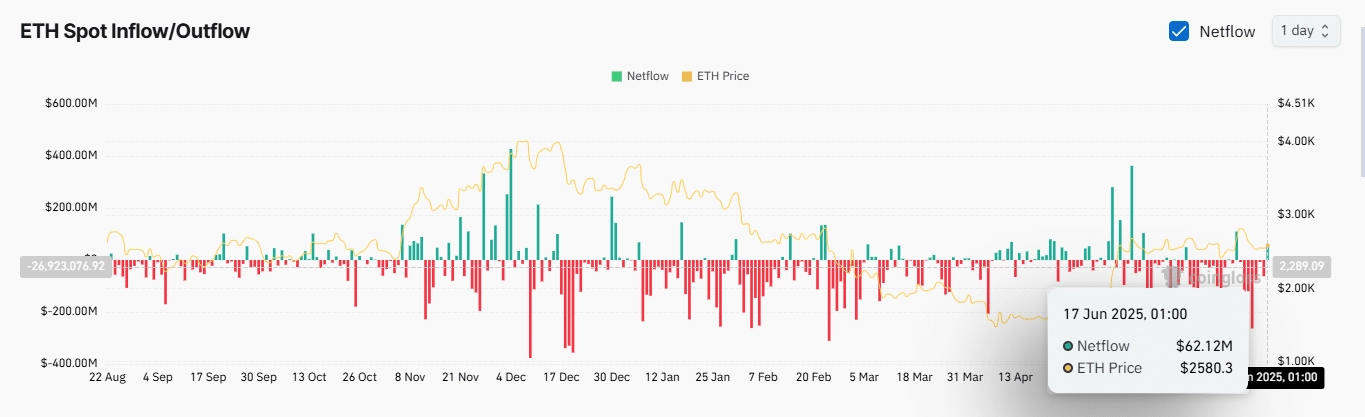
Source: CoinGlass
This move appears to be a capital-preservation tactic, as these investors anticipate a potential ETH dropcontributing to the recent price decline.
Continued spot selling is likely to exert more pressure on the market, possibly pushing ETHs price further down.
What does the chart say?
ETH has continued to consolidate since entering this phase on the 13th of Mayover a month ago.
Typically, inflows of this kind suggest investors are accumulating ahead of a potential breakout and a longer-term rally.
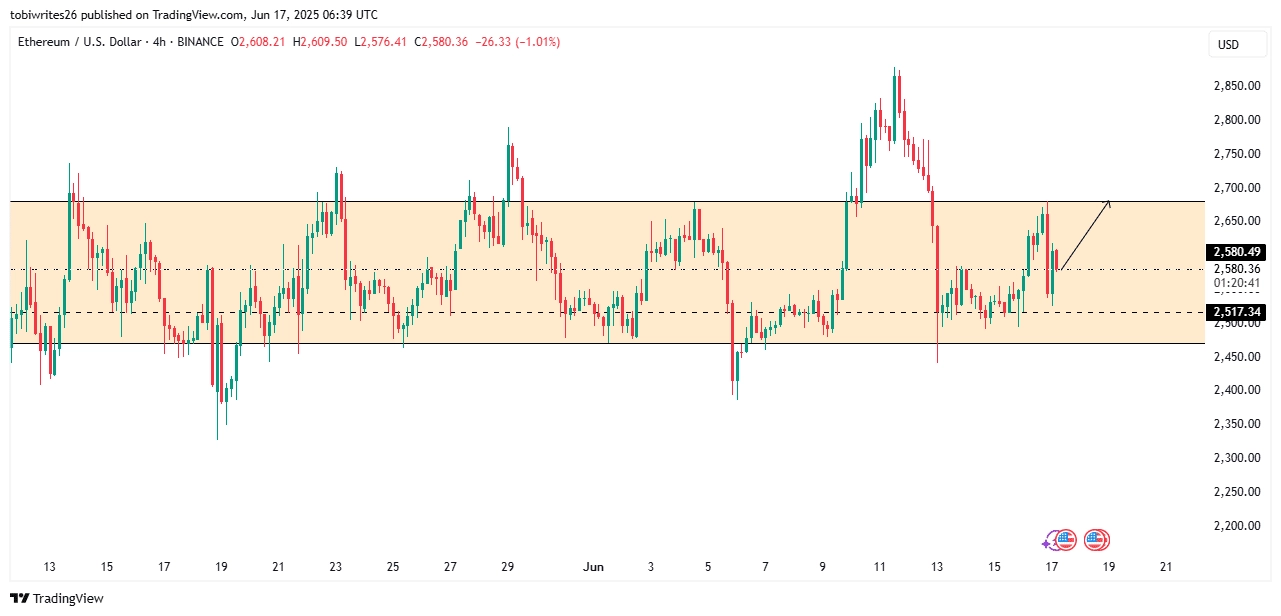
Source: Trading View
However, in the short term, ETH faces two potential outcomes. It could rally from its current support level, breaking toward the channels resistancewith momentum determining the next move.
Alternatively, it may decline to the lower boundaries of one of the next two support levelseither the dashed line or the channels lower support.
The direction ETH takes from either point will largely depend on market momentum.