
![]()
contributor
Posted: November 13, 2024
Share this article
- FTM’s symmetrical triangle pattern hinted at a potential breakout, with $0.93 as key resistance
- On-chain metrics were largely bullish, though low active address growth suggested caution
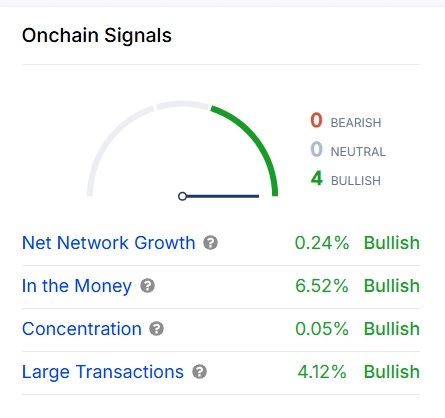
Fantom [FTM] , at the time of writing, was showing promising signs of a potential breakout from a symmetrical triangle pattern, one supported by strong on-chain metrics and technical indicators. In fact, recent data revealed a “Mostly Bullish” sentiment, with four key on-chain signals – Net network growth, in the money, concentration, and large transactions—all suggesting a positive outlook.
With a press time price of $0.7459, after falling by 5.26%, FTM’s performance now hinges on whether it can overcome critical resistance levels. However, not all indicators fully supported an imminent breakout, adding some uncertainty.
Technical analysis – Is FTM ready for a breakout?
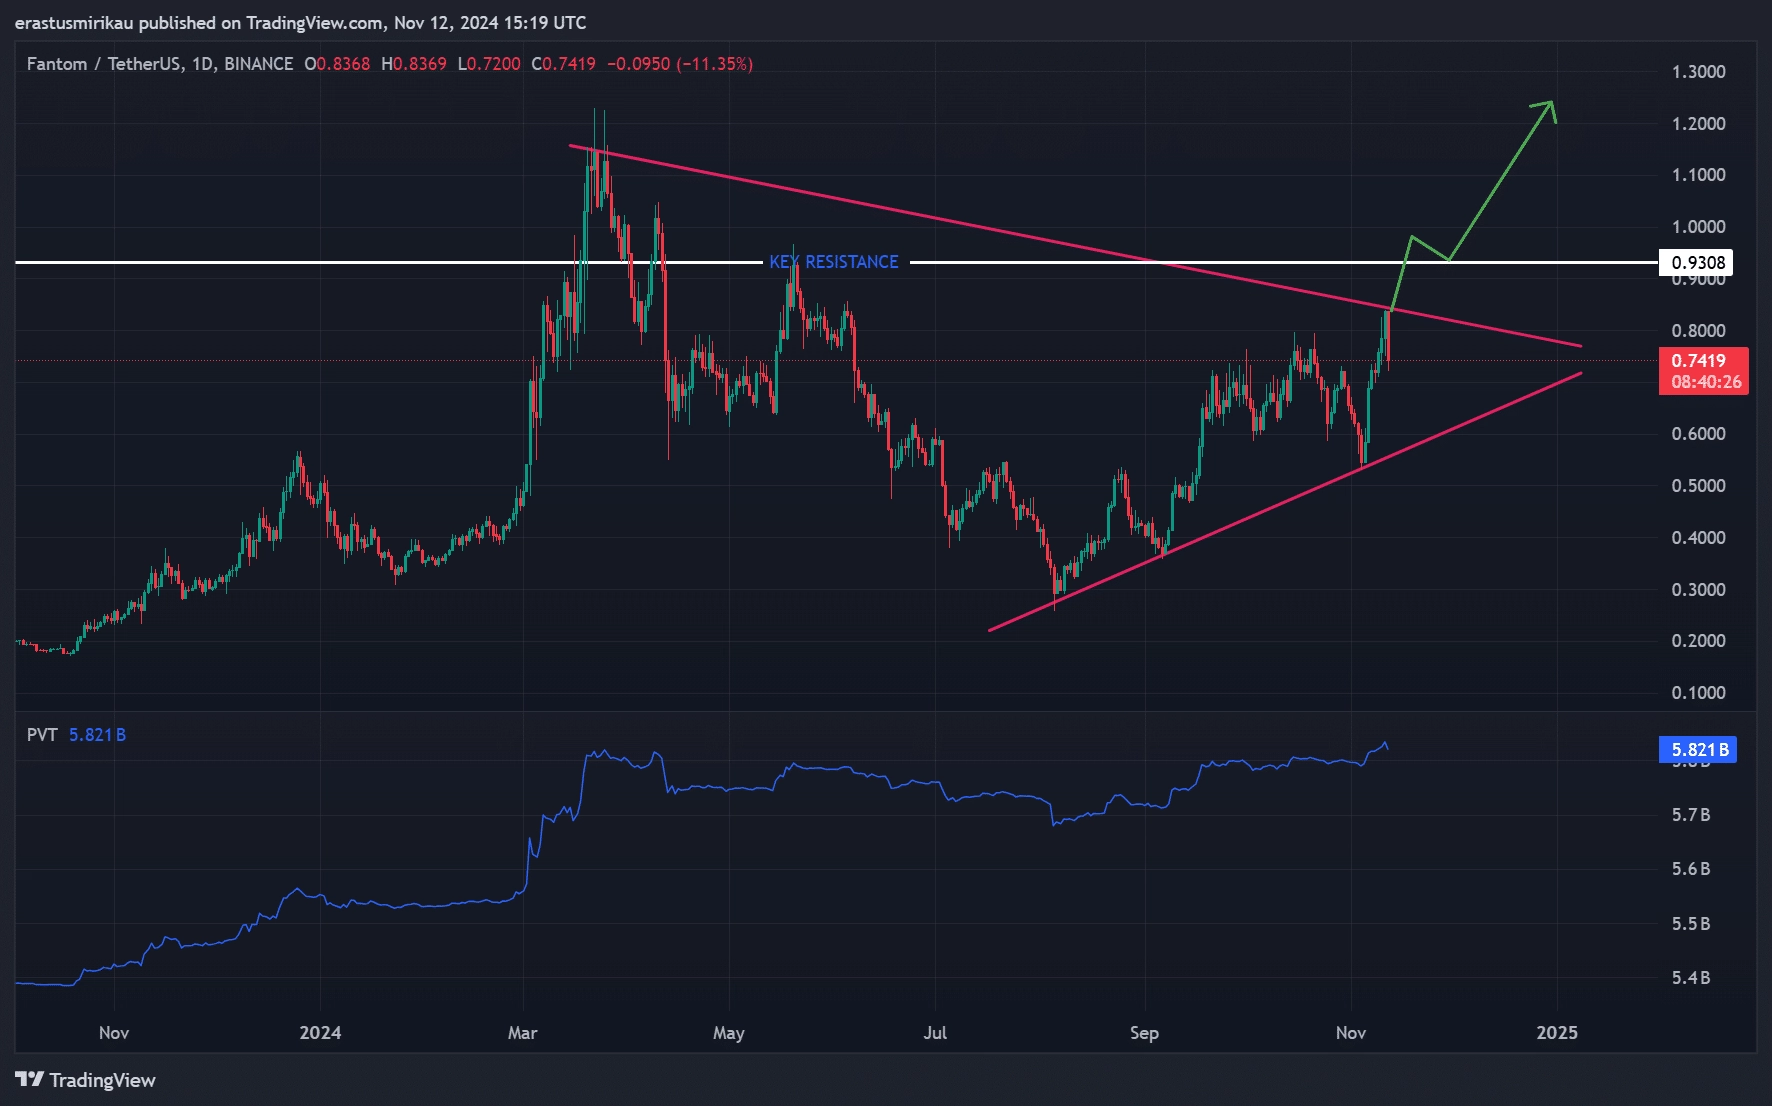
FTM’s price action seemed to be forming a symmetrical triangle pattern – Often a sign of an impending breakout. This pattern, marked by converging trendlines, suggested that FTM might soon make a significant move. If this triangle breaks upwards, it could confirm bullish momentum. However, breaking through established resistance levels will be crucial to validate this movement.
FTM faces a significant resistance level at $0.93, which has historically acted as a ceiling for upward movement. A decisive break above this level could encourage further gains, with a potential target around $1.20 based on previous price action. Consequently, failing to clear this resistance could see FTM trapped within the current consolidation phase.
The price volume trend (PVT) revealed steady growth, indicating a hike in buying interest. This metric pointed to underlying bullish sentiment, suggesting that a breakout could gain strength if accompanied by a surge in trading volume. However, without a major volume spike, the breakout may lack the momentum needed for sustainability.
Source: TradingView
FTM on-chain metrics support a cautiously bullish sentiment
The on-chain metrics largely supported a bullish outlook, though with some caution. Net network growth was up by 0.24%, showing a steady influx of new users. Additionally, 6.52% of FTM addresses remain “In the Money,” reducing the likelihood of sell pressure from profitable holders, which often supports price stability.
The large transaction metric was up by 4.12%, highlighting interest from institutional and high-net-worth investors – A positive sign for future price action. Concentration among large holders at 0.05% also implied that whales have been retaining their positions, underscoring confidence in FTM’s long-term potential.
Source: IntoTheBlock
Price-DAA divergence signals caution
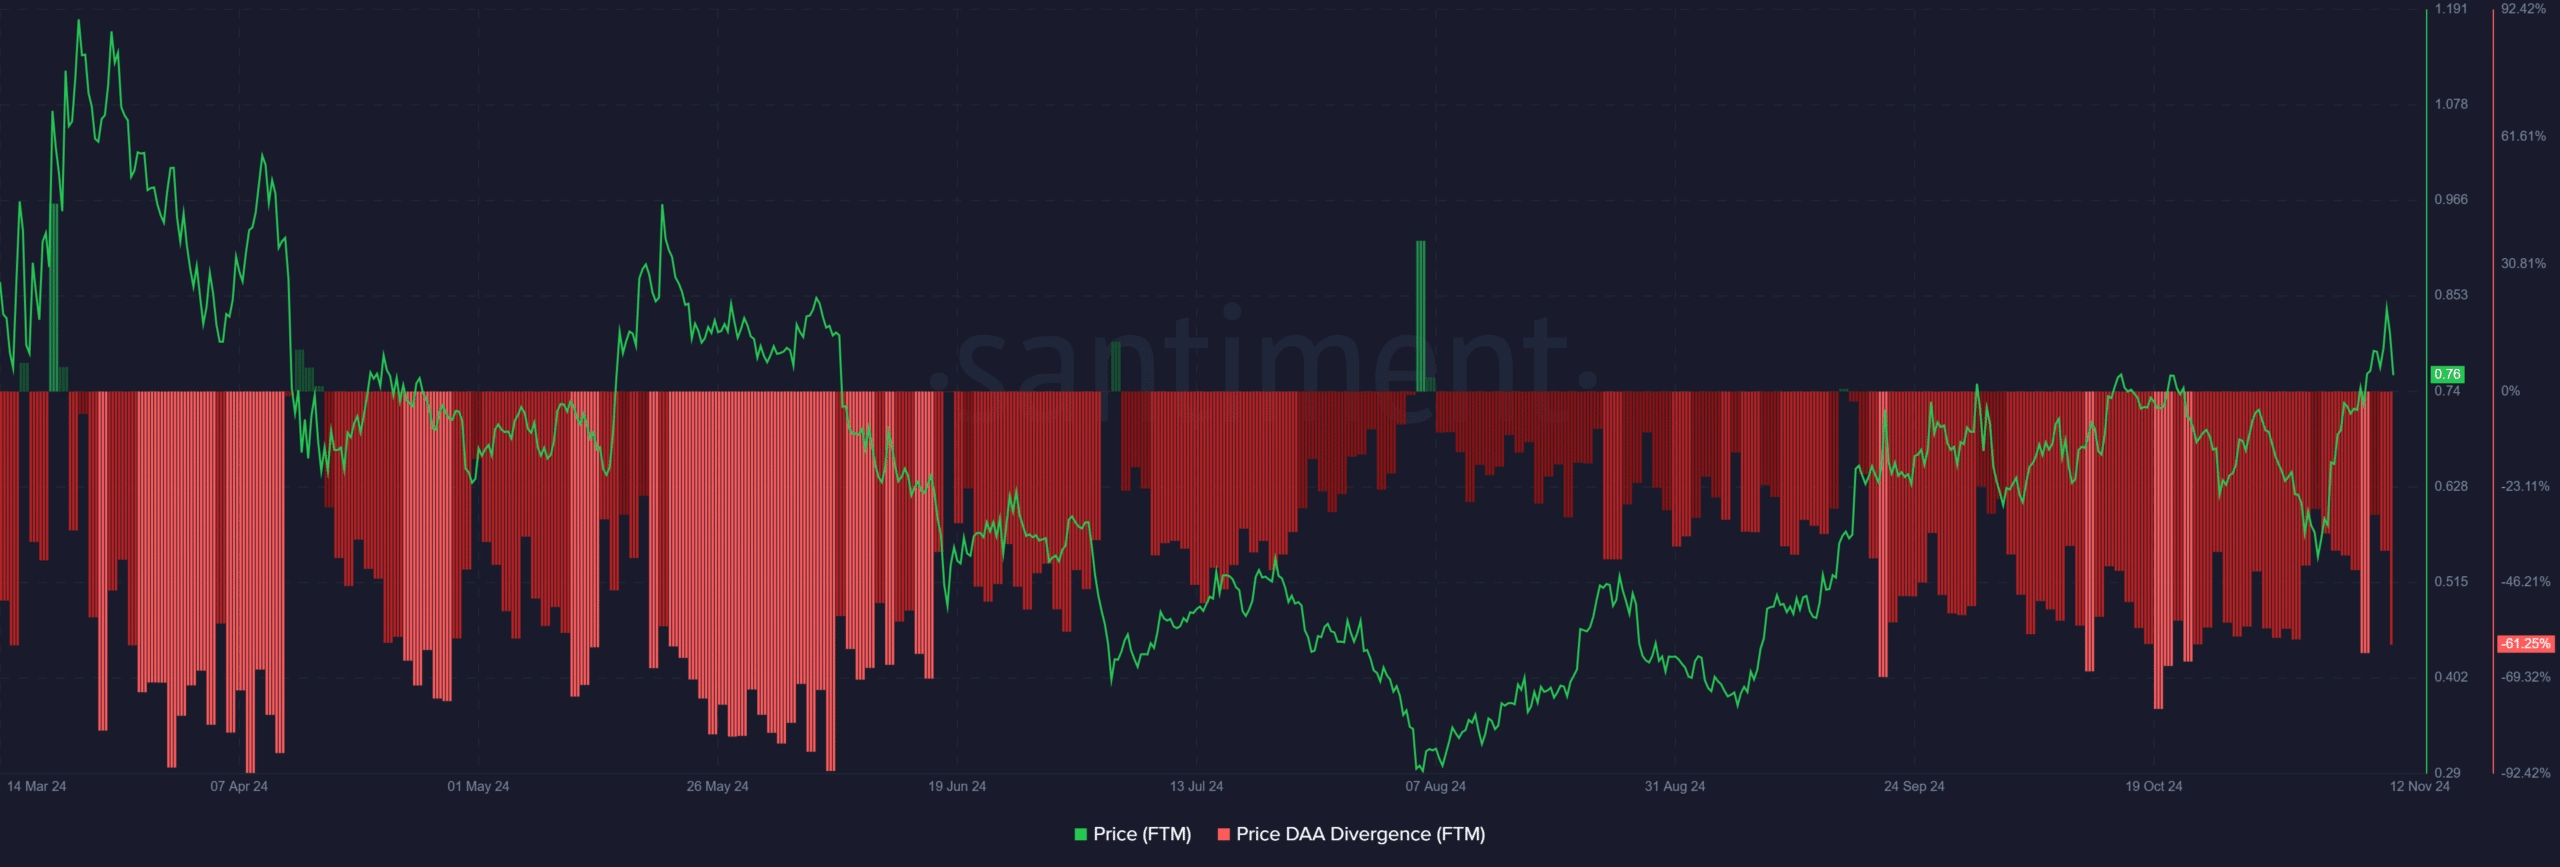
The price-daily active addresses (DAA) divergence had a reading of -61.25%, indicating that the price outpaced user activity growth. This divergence is a cautionary signal, suggesting that FTM’s price movement might not be fully supported by network activity, which could limit upward momentum.
Source: Santiment
Market sentiment with Open Interest in focus
At the time of writing, the Open Interest for FTM Futures stood at $193.63 million, with a fall of 2.79%. This dip in Open Interest highlighted some caution among traders, suggesting that market participants may be hesitant to commit strongly in either direction, This could affect FTM’s ability to sustain a breakout.

Source: Coinglass
Read Fantom’s [FTM] Price Prediction 2024-25
A mixed outlook with cautious optimism
Based on the data analyzed, FTM flashed both bullish and cautionary signals. While technical patterns and on-chain metrics leaned towards a potential breakout, the low daily active address growth and slight decline in Open Interest suggested caution.
Therefore, a confirmed breakout above $0.93 is crucial to validate further gains. Otherwise, FTM’s price might remain in its current consolidation range.

